Overview
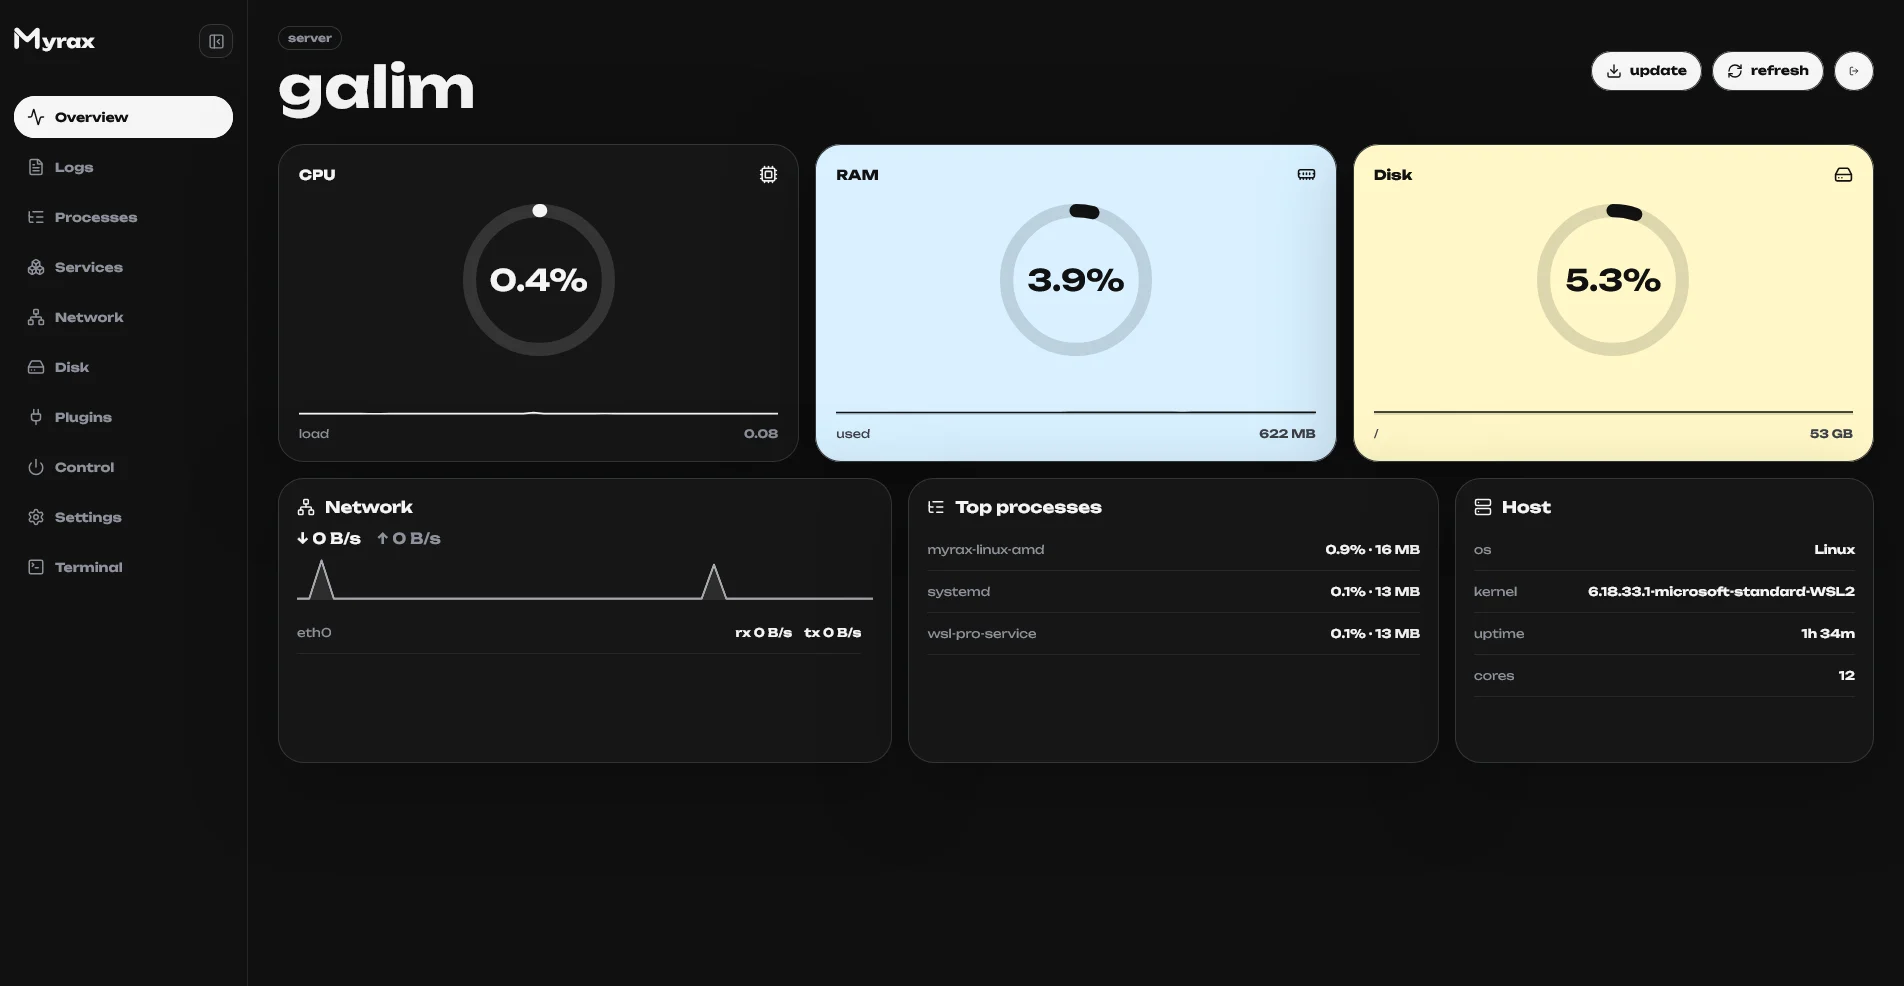
- CPU / RAM / Disk — ring gauges with live sparklines (last ~48 samples, kept across tab switches).
- Thresholds — cards repaint when a metric crosses its limit: yellow at
CPU 75% / RAM 80% / Disk 75%, red at 90 / 92 / 85. A badge shows
elevatedorhigh. - Network — total ↓ / ↑ since boot plus a dual sparkline of current rx/tx rates.
- Top processes — top 3 by CPU with memory usage.
- Host — hostname, distro, kernel, uptime, load.
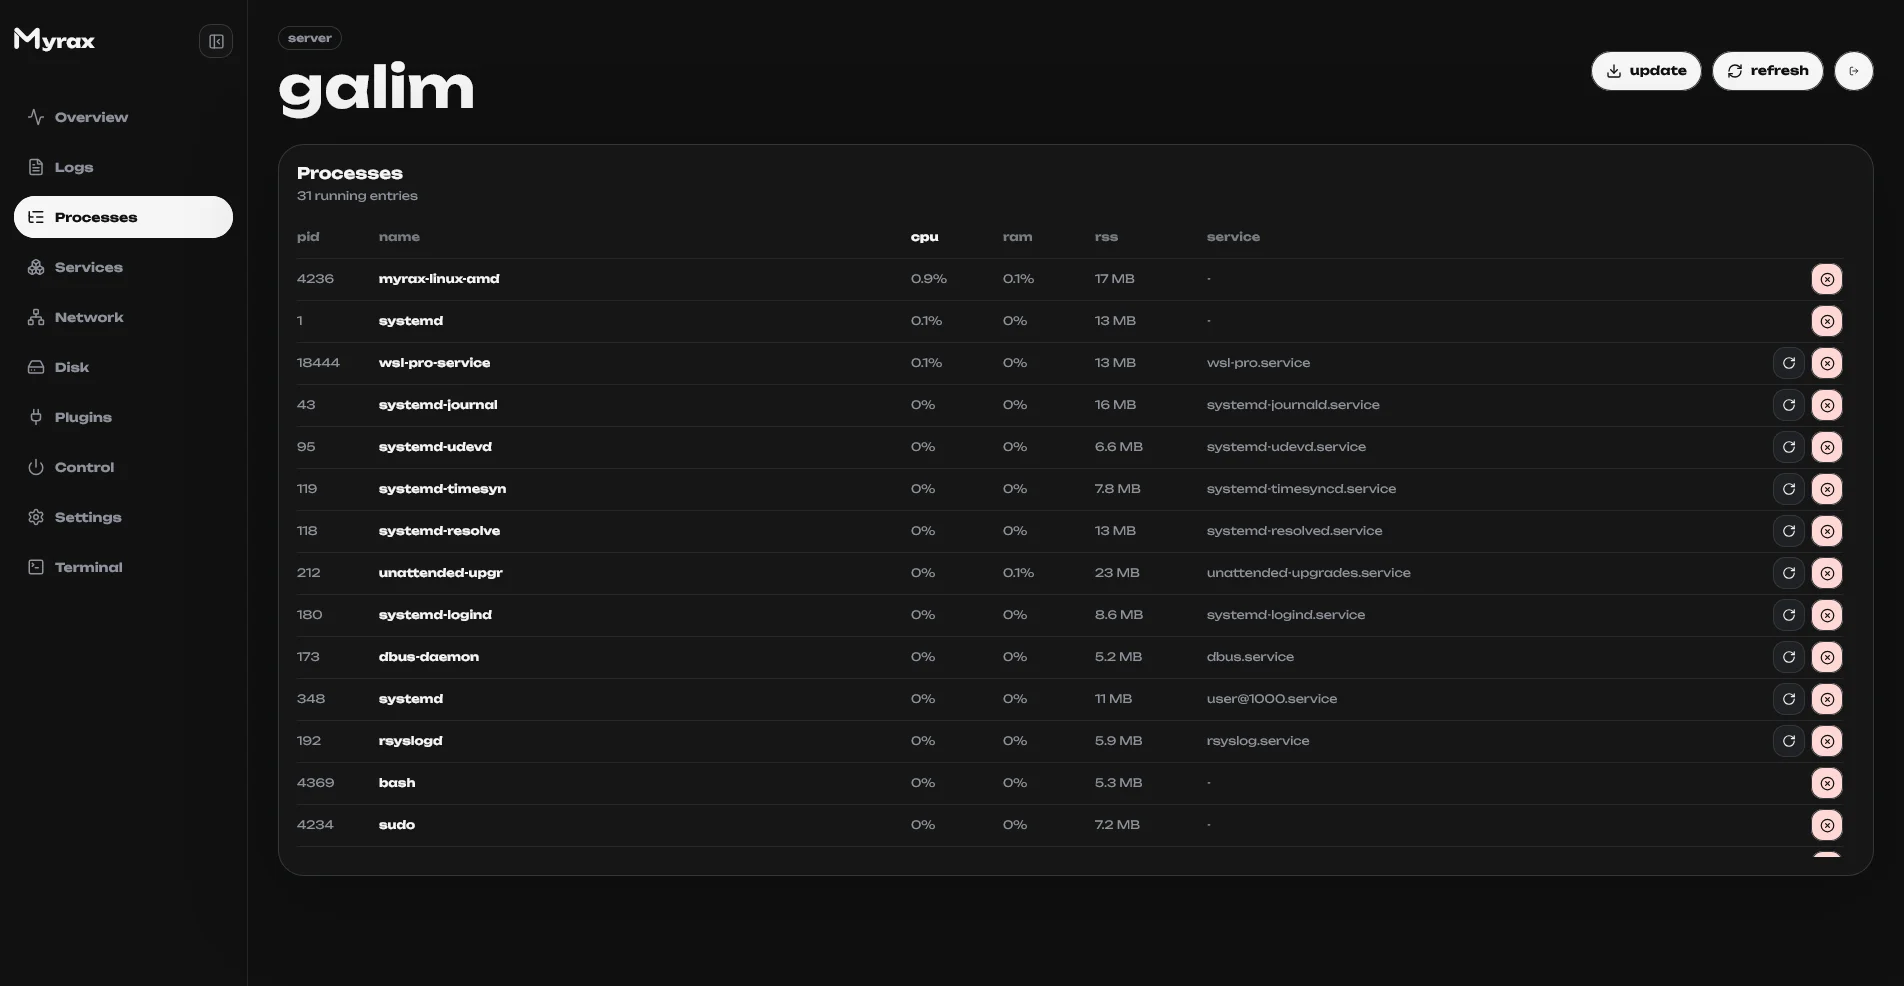
Processes
Services
systemd units: status at a glance, start / stop / restart per unit.Network & Disks
Per-interface throughput with live graphs; mounted volumes with size, used space and usage bars.Logs
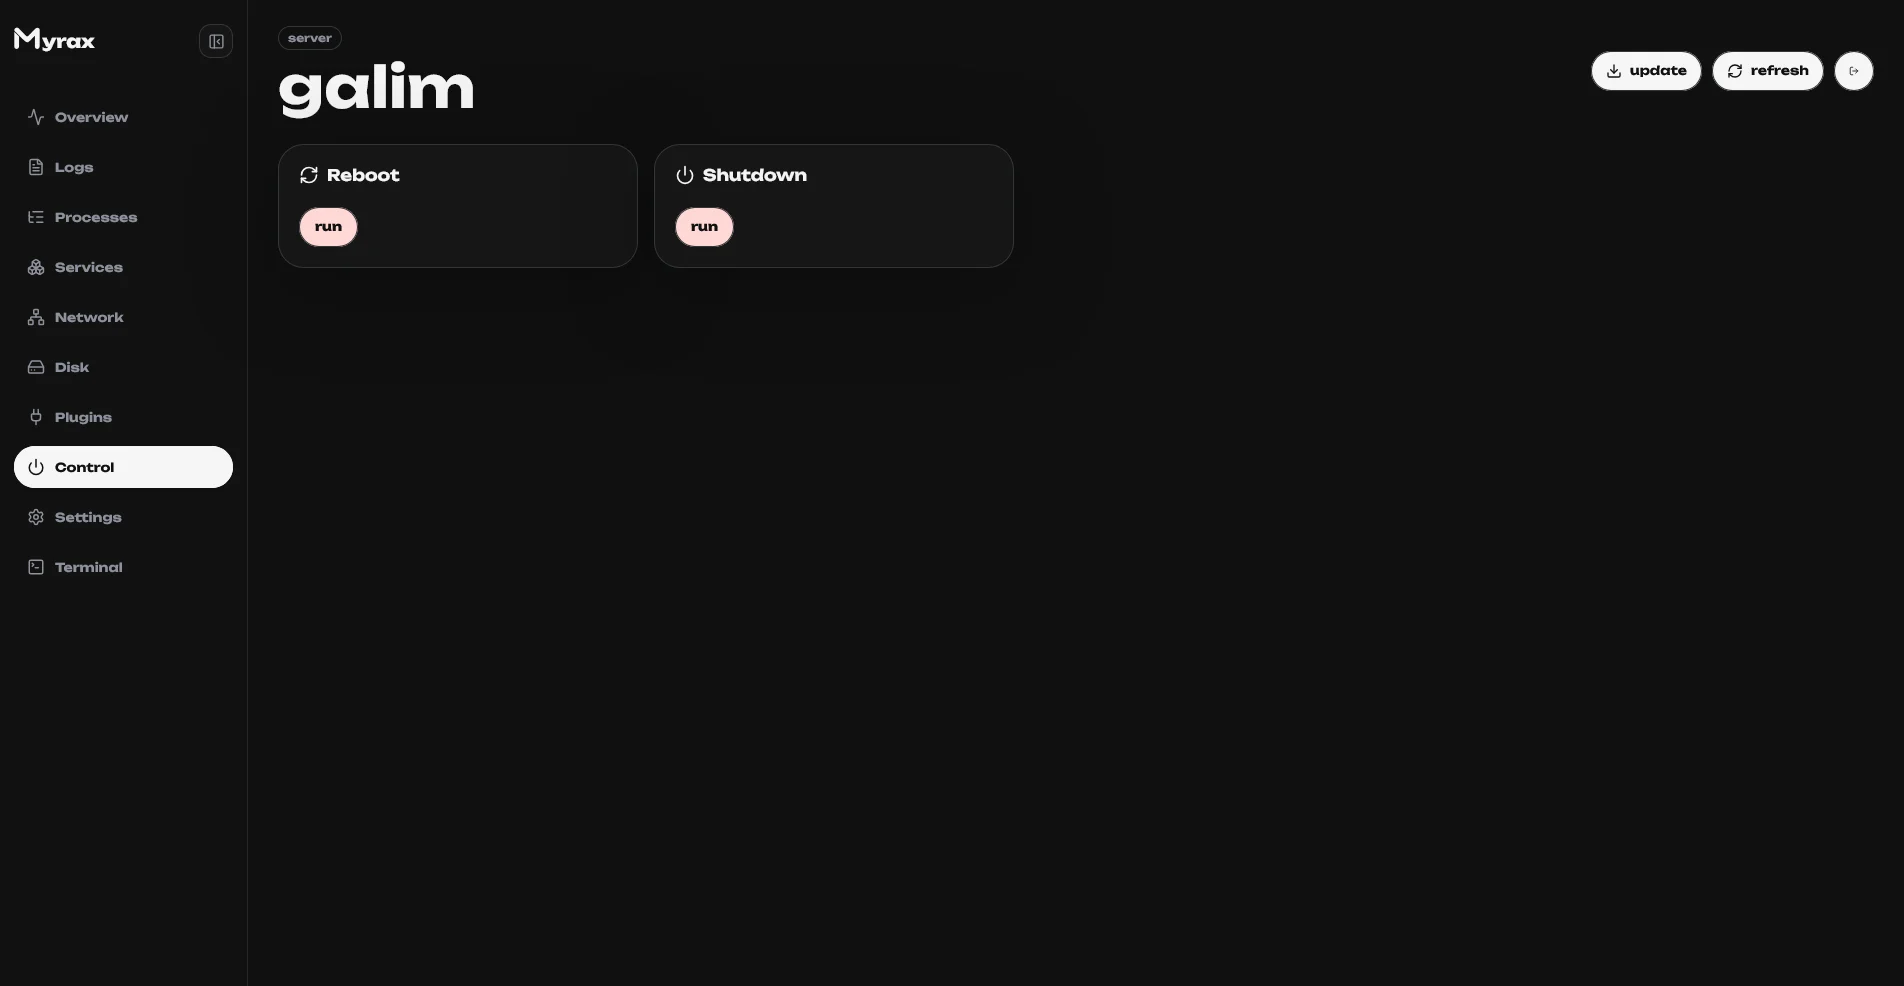
Journal tail streamed to the browser over SSE.Control
Settings
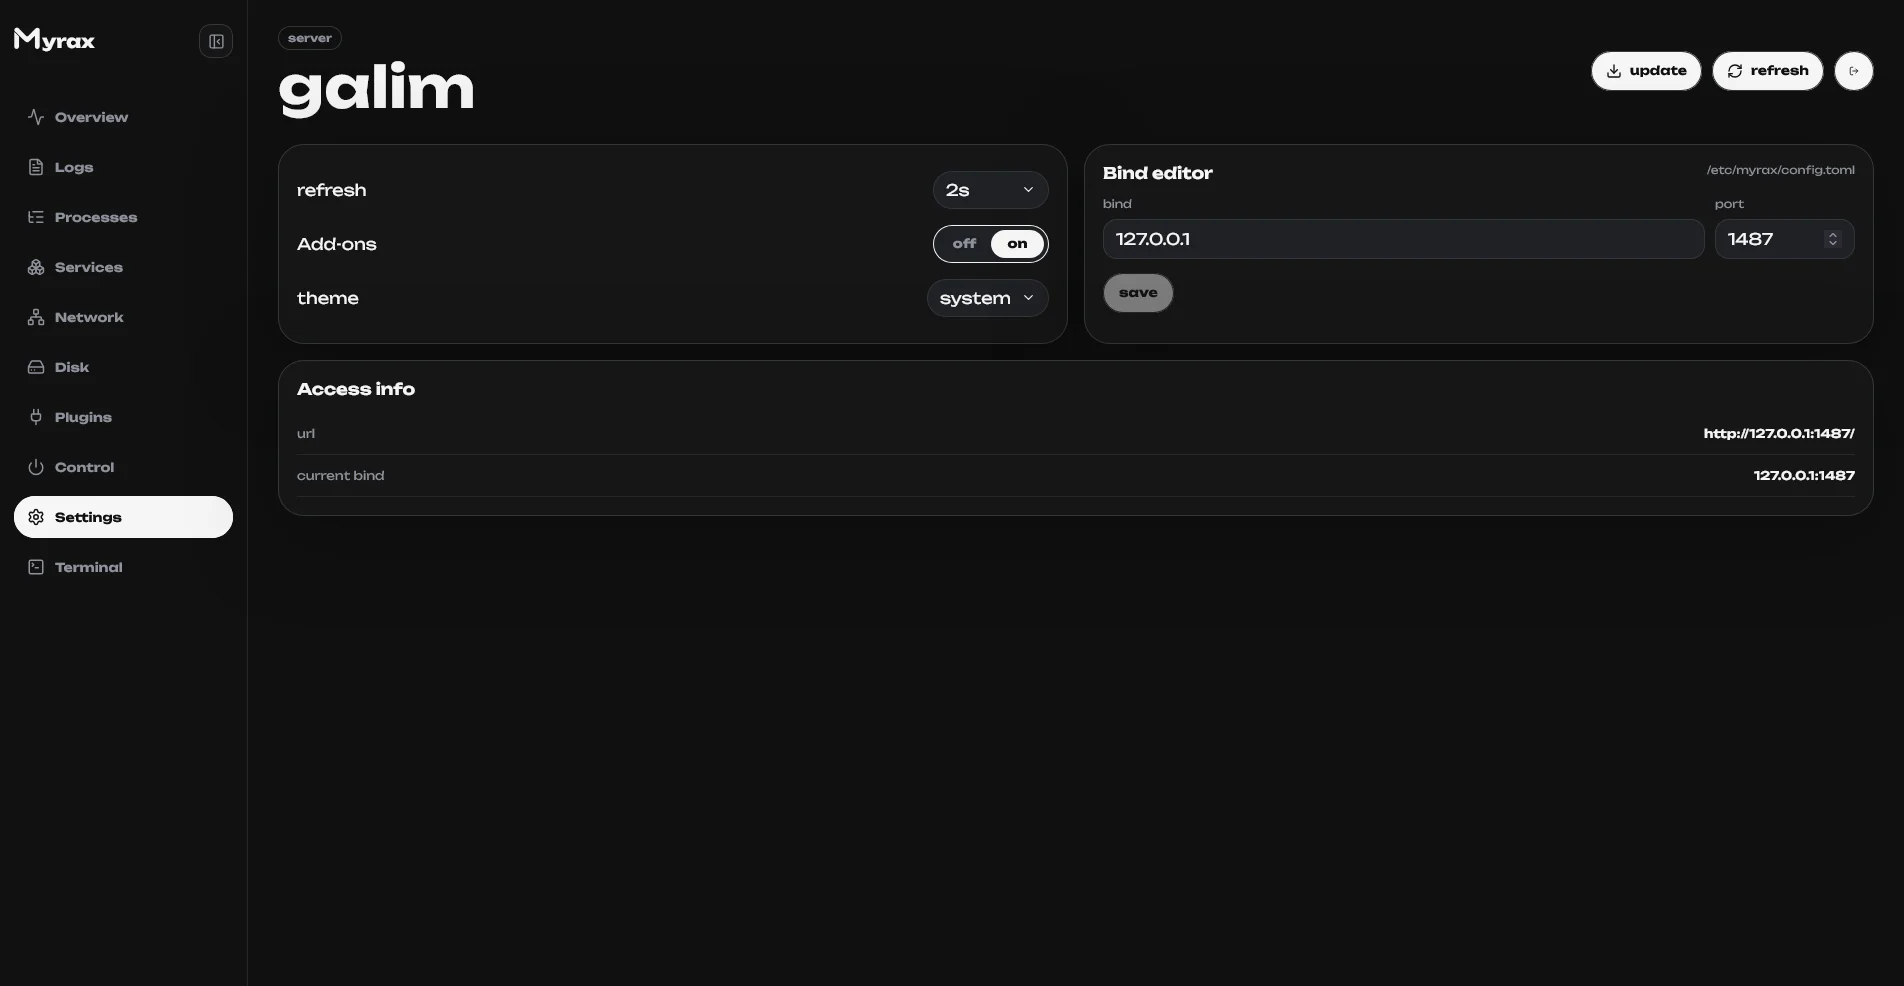
- Refresh rate, theme (dark / light / system).
- Bind editor — host, port and panel path, same as
myrax configure. - Add-ons toggle — turns the plugin system on; the Plugins screen and the store appear once enabled.